Systemic design integrates systems thinking and human-centred design, with the intention of helping designers cope with complex "wicked problems" through design projects that foster system change.
What is systems mapping?
System mapping is the process of creating a diagram to represent the elements and relationships of s system
System maps aim to give an overview of a system and how the parts interrelate to form the whole. In short they show the landscape in which actors exist.
Why is systems mapping beneficial?
- Build consensus so we all are working from the same understanding.
- Can bring together and communicate complexity to diverse stakeholders.
- Understand interconnectedness.
- To be able to see the big picture of the system.
- Visual representation of complexity.
How to start mapping systems?
Define the Purpose:
Begin by clearly outlining your objectives. Are you designing the map to identify gaps in care, communicate with stakeholders, or plan integrated services? Having a clear purpose will guide your map's development.
Understanding the current system
There are multiple ways to start mapping the system. The first step is to understand the current system as it is. You can start by identifying different services through desk research or speaking to stakeholders. Another way of doing this is to ask stakeholders to draw a map of the current system as they understand it.
The stakeholders are the ‘system experts’ as they have insights of the system better than anyone else. For example, stakeholders in an NHS health boards in Scotland mapped out existing mental health and substance use services, identifying key elements such as:
- Service providers: These are the organisations and facilities that offer mental health and substance use services, hospitals and clinics including specialist units.
- Key stakeholders: These could be government agencies, third sector, advocacy groups, housing and social support and individuals who play a significant role in either using or shaping the services and policies related to mental health and substance use.
- Service Parts: These could be different types of services provided, such as therapy, addiction treatment, crisis intervention, harm reduction services.
- Patient pathways: This shows different entry points to the system and how patients move around different services
- Policies and regulations: Places where medication assisted treatments (MAT) are delivered, etc.
- Service interventions: Places where proposed interventions and test of change take place, and where additional capacities are being introduced.
- Gaps: These could be any gaps that stakeholders have identified but do not know where to fit in.
System maps can include various elements and components, depending on the specific context and purpose of the map. Once the initial system map is developed, refine it by clustering related components and drawing meaningful connections.
Service Clustering and defining boundaries
Group similar services based on their function and purpose. This process may require multiple iterations to refine the map’s focus and define its boundaries. For example, you can cluster:
- Services by level (e.g., primary care, secondary care, third-sector providers).
- Stakeholders within each cluster, ensuring all key players are identified.
Clusters serve as the system's building blocks and can be represented using distinct shapes, colours, and labels to create subsystems within the larger system.
Some examples of clustering include:
a) Group services that are offered at different levels such as primary care, secondary care and third sector providers.
b) Identify key stakeholders operating within these service clusters and their roles within the system: Make sure to Identify any missing stakeholders and service providers.
Clustering service parts and components can act as fundamental building blocks of the system. They can be represented as nodes or shapes in the map and include things like organisations, individuals, processes, or physical objects. In our map these were the service providers and stakeholders. To help recognise them easily, we have used shapes, colours and labels to differentiate clusters from one another. By doing that we created subsystems within the larger system.
Drawing connections
After clustering, identify relationships between components to highlight system dynamics and interconnectedness between clusters and how they are related. Different types of connections can be represented using:
- Lines and arrows: To draw connections and show different relationships and this may include input-output relationship.
- Colours: To differentiate pathways, such as entry routes and discharge pathways.
- Line styles and weights: Apply different weighting and different line styles to show various relationships ( e.g. solid lines for direct relationships, dotted lines for potential connections, thicker lines for strong connections and directional arrows)
- Temporal aspects: Indicating temporal aspects of the system, such as timeframes, waiting time or duration of care can help in understanding the system's dynamics over time.
Highlight the map focus
There may be different things you want to highlight in the service map. For instance:
- Service Access Points: Highlight areas where services are accessible and areas with limited access. This shows where bottlenecks in the system are, including which services require more resources, input and capacities to deliver the service better.
- Patient Pathways: Map out the typical pathways patients follow when seeking help, including referrals, intake processes, and ongoing care including timeline. The relationships between different service providers and how patient pathways fit in within the current system is important to represent various types of connections, such as causality, influence, communication, or dependency.
When drawing connections you can also highlight feedback mechanisms that exist within the system. These loops show how changes or actions in one part of the system can loop back and affect other parts, creating dynamic behaviours, often in a cyclical manner.
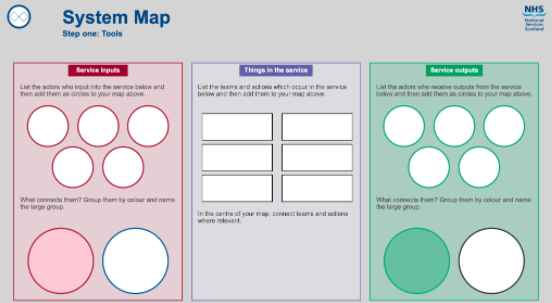
System Mapping tool
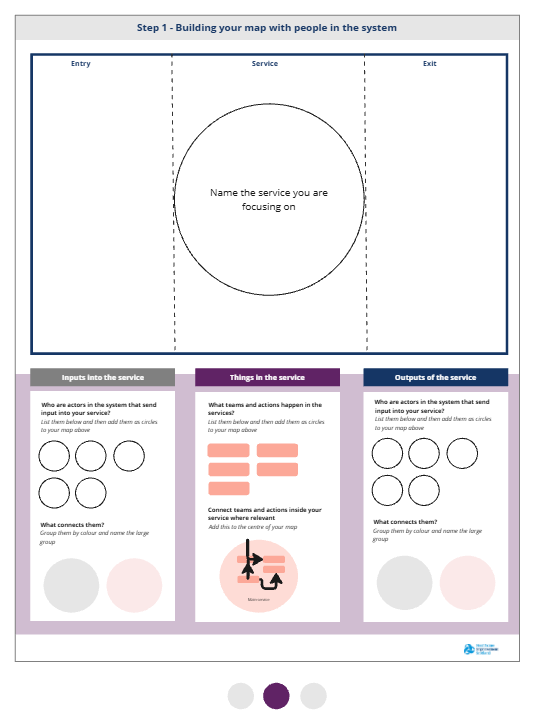 Download system mapping tool
More templates from the Design Community
 Download NSS template